Introduction: Why Pollen Forecasts Matter
A pollen forecast tells you how much pollen is in the air on a given day and which types of pollen are most active. For millions of Canadians living with seasonal allergies, this information plays a major role in daily comfort, productivity, and overall health. Whether symptoms include sneezing, congestion, itchy eyes, or breathing difficulties, pollen exposure is often the root cause.
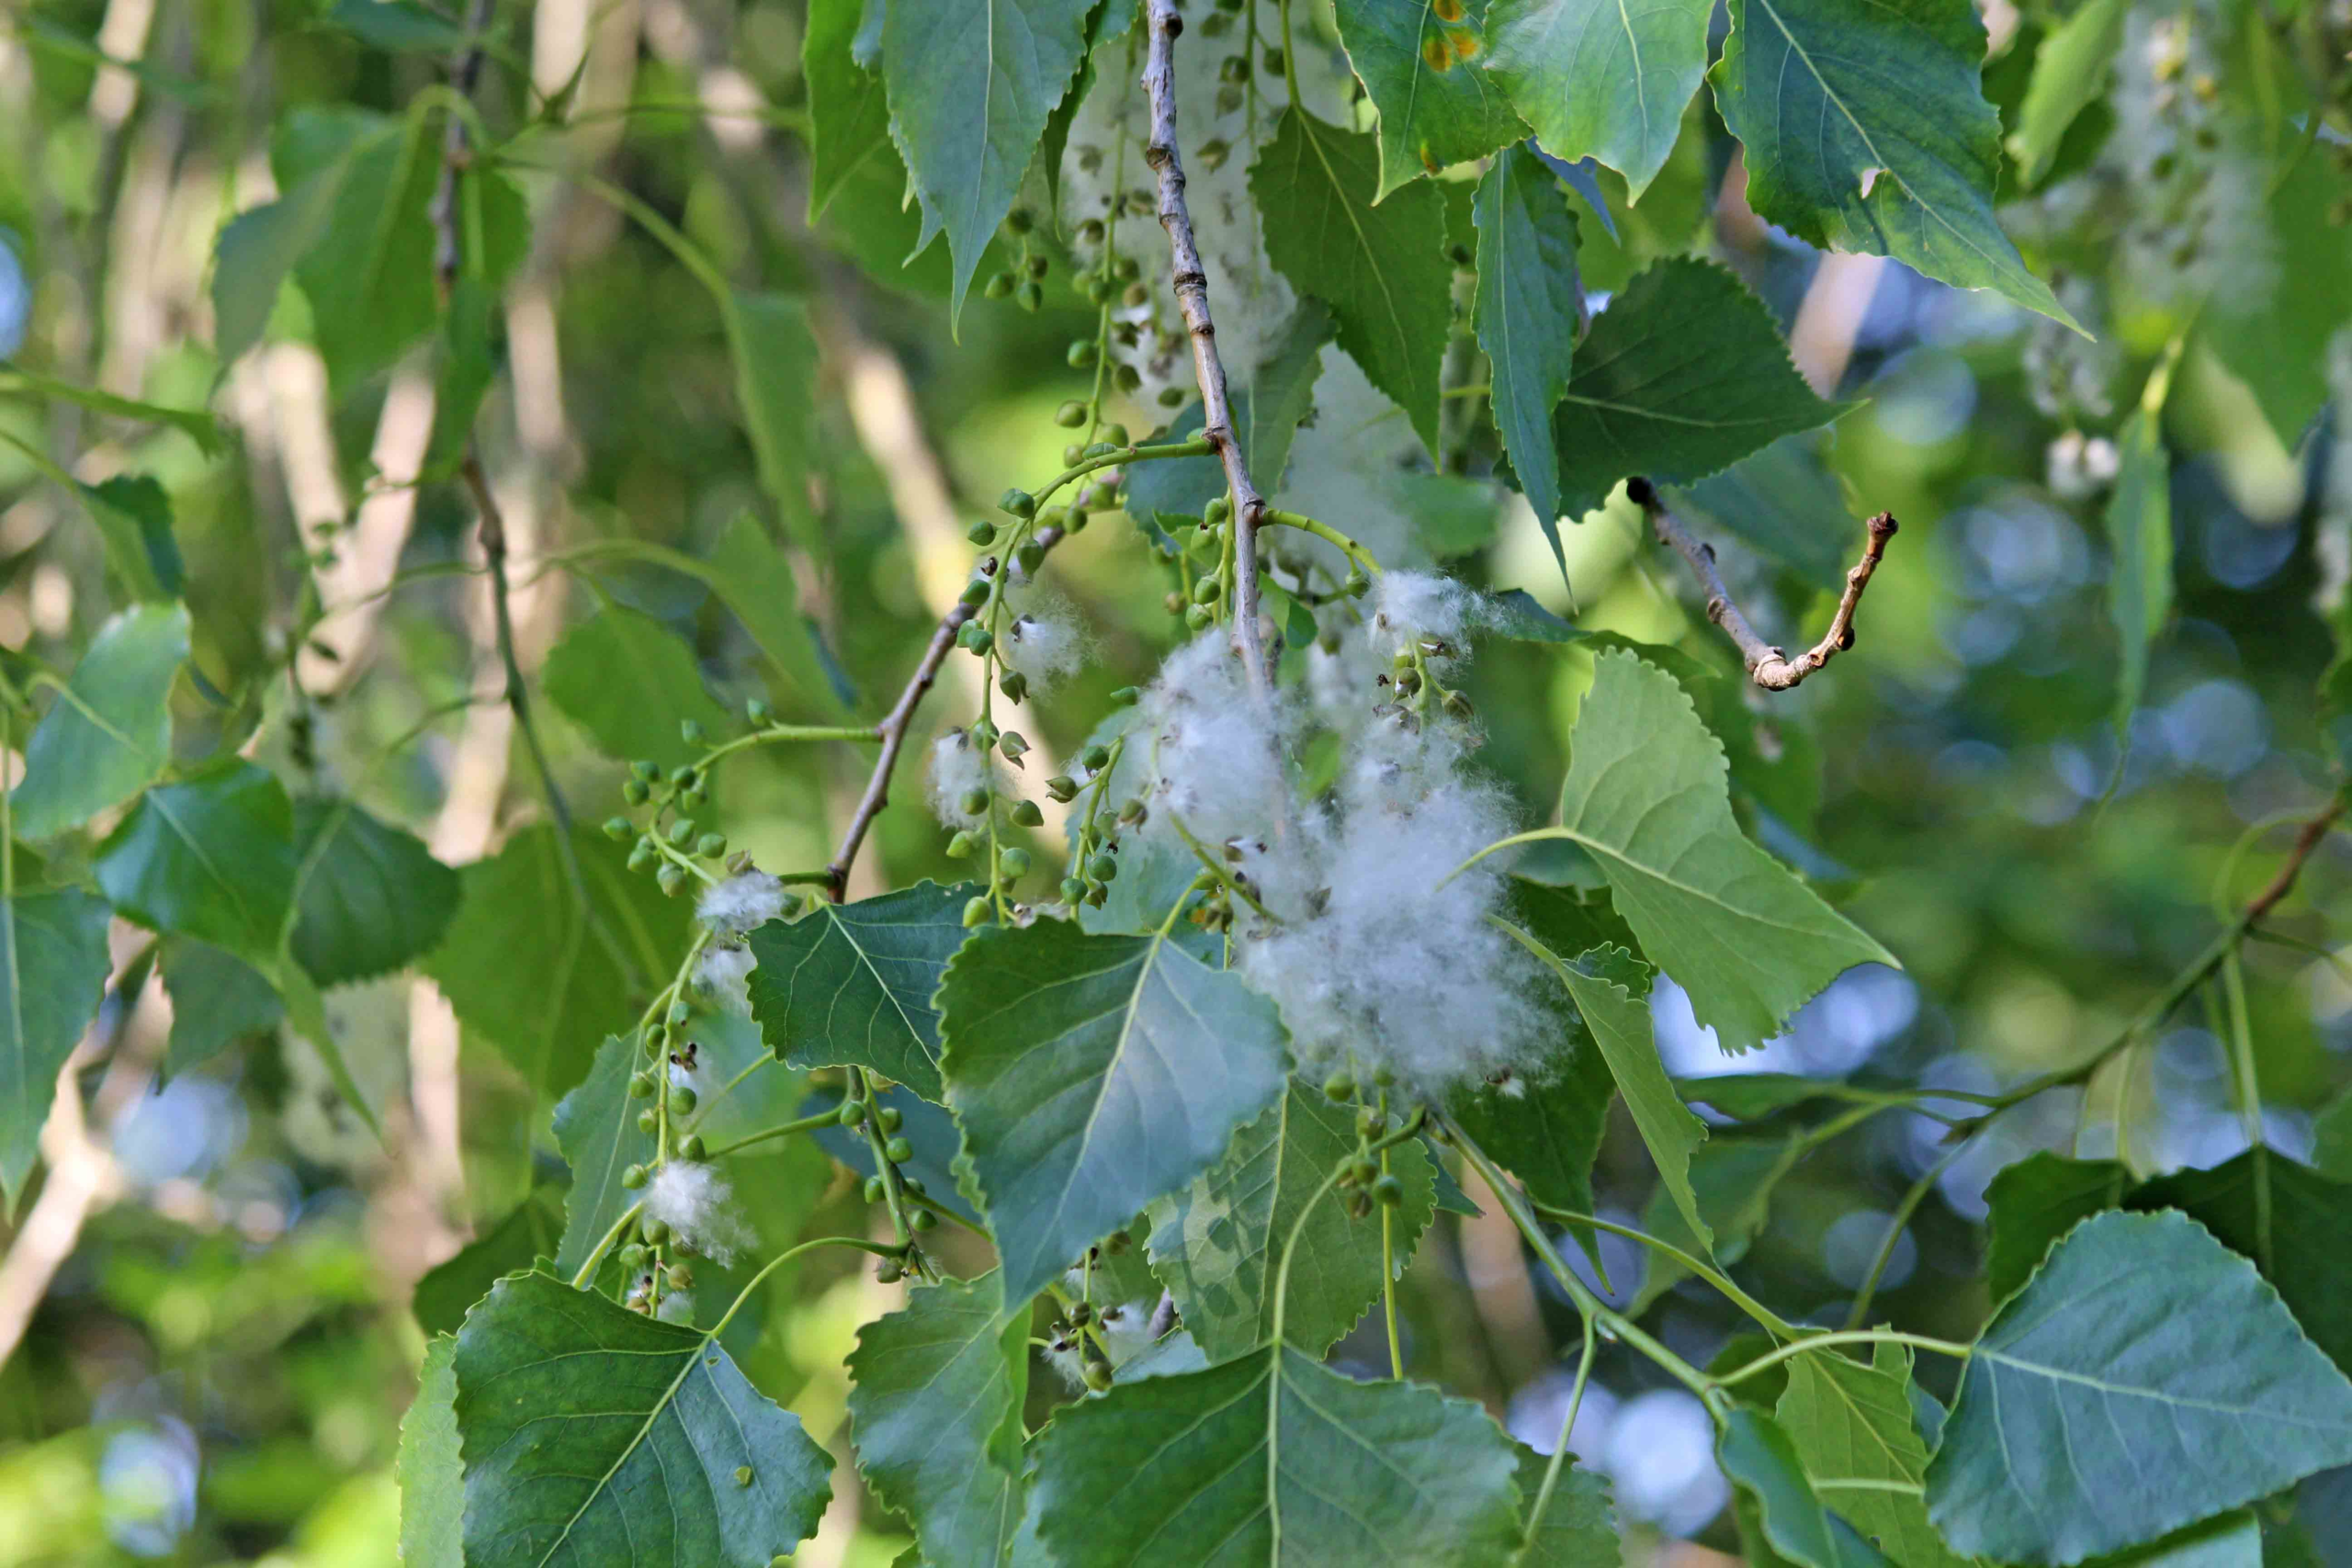
Pollen levels are not constant. They change daily depending on plant cycles, weather conditions, and geographic location. From early spring tree pollen to summer grasses and late-season weeds, allergy triggers shift throughout the year. A reliable daily pollen forecast helps allergy sufferers plan ahead, reduce exposure, and avoid unexpected flare-ups that can disrupt work, school, or outdoor plans.
Understanding what today’s pollen data actually means empowers people to make better choices and take control of their allergy management.
How Pollen Forecasts Are Created
Pollen forecasts are based on real environmental monitoring rather than guesswork. Across cities and regions, air samples are collected daily using specialized pollen traps. These devices are designed to capture microscopic pollen grains that are suspended in the air throughout the day.
Pollen traps operate continuously, Pollen traps operate continuously, trapping particles on collection rods or filters. Over time, this creates a representative sample of what people are breathing outdoors. The goal is to measure actual airborne pollen rather than relying solely on plant growth calendars or historical averages. That is the difference between an 80% forecast accuracy like Aerobiology Research Laboratories (ARL) produces and the others who use no data and their accuracy rate is below 39%.We collect actual data at ARL where the rest of them do not, they just really guess.
Once air samples are collected, they are transported to the laboratory for detailed examination. This lab-based approach ensures that pollen data is accurate, consistent, and scientifically reliable. Without laboratory analysis, pollen forecasts would lack precision and could not reflect real-world conditions.
The Role of Laboratories in Pollen Forecasting
Laboratories play a critical role in producing an accurate pollen forecast. Inside the lab, trained technicians analyze collected air samples using microscopes and standardized counting methods. Each pollen grain has a unique shape, size, and surface pattern, allowing experts to identify whether it comes from trees, grasses, or weeds.
This step is essential because not all pollen affects people in the same way. Some individuals react strongly to tree pollen or more specifically Birch, Alder or Oak, while others are more sensitive to grass or weed pollen like ragweed. Laboratory identification allows forecasts to highlight which pollen types are currently dominant.
In laboratories, analysts typically:
- Identify the specific types of pollen present
- Measure the concentration of pollen grains in the air
- Track patterns and trends across days, weeks, and seasons
By comparing daily counts with historical data, laboratories help detect whether pollen levels are rising, peaking, or declining. This transforms raw air samples into meaningful insights that can be shared through daily pollen forecasts and allergy risk reports. Without laboratory verification, pollen forecasts would be far less reliable and much less useful to allergy sufferers.
Understanding Pollen Levels Today
When checking pollen levels today, two main factors matter: the amount of pollen in the air and how sensitive an individual is to that pollen.
Pollen Levels Today
Pollen levels are typically grouped into clear categories to make them easy to understand:
- Low: Minimal impact for most people, including many allergy sufferers
- Moderate: Mild symptoms may occur for people with sensitivities
- High or Very High: Strong likelihood of allergy symptoms, especially with outdoor exposure
These categories are based on laboratory counts of pollen grains found in daily air samples. Higher numbers mean more pollen circulating in the air, increasing the chance of symptoms.
Allergy Risk
Allergy risk is influenced by more than just pollen counts. Individual sensitivity varies widely, meaning one person may experience symptoms at moderate levels while another may feel fine. Weather conditions also play a major role.
Warm, dry, and windy days often increase pollen movement and distribution, raising allergy risk. Rain can temporarily reduce pollen levels by washing particles out of the air, though levels may rebound quickly once conditions dry out again. Understanding these factors helps explain why symptoms can feel worse on certain days even when pollen levels seem similar.
Why Daily Pollen Forecasts Are Important
A dependable daily pollen forecast helps Canadians make informed decisions about their health and daily routines. With lab-verified data from Aerobiology Research Laboratories, allergy sufferers can take proactive steps instead of reacting after symptoms appear.
Daily forecasts allow people to:
- Adjust outdoor plans on high-pollen days
- Take allergy medication before symptoms worsen
- Manage asthma and respiratory conditions more effectively
- Reduce exposure for children, seniors, and other vulnerable individuals
For people with chronic allergies or asthma, this information can significantly improve quality of life. Laboratory analysis adds confidence that the forecast reflects real conditions rather than estimates or assumptions.
Using Pollen Forecasts in Everyday Life
Pollen forecasts are most effective when used consistently. Simple daily habits can make a noticeable difference when guided by accurate data.
Here’s how to use pollen forecast information effectively:
- Check pollen levels early in the day before going outside
- Limit outdoor exposure when pollen levels are high
- Keep windows closed during peak pollen periods
- Shower and change clothes after spending time outdoors
- Follow daily updates throughout allergy season
These small adjustments help reduce pollen exposure indoors and prevent symptoms from building up over time. When paired with medication or other allergy management strategies, pollen forecasts become a powerful preventive tool.
Conclusion
A pollen forecast is the result of careful environmental monitoring combined with detailed laboratory analysis. By understanding pollen levels today and the associated allergy risk, Canadians can better manage seasonal allergies and protect their well-being.
With laboratory verified data behind each forecast, allergy sufferers gain reliable insight into what they are breathing every day. This knowledge helps turn unpredictable allergy seasons into manageable routines, allowing people to plan with confidence, reduce symptoms, and enjoy daily life with fewer interruptions.
Download the App for Personalized Pollen Insights
Here are some specifics of the app. We also analyze over 70 pollen and outdoor moulds (spores).
- Push notifications get alerts when pollen and/or moulds are at certain levels where you are. You can pick which pollen and spore types and the levels you want notifications about.
- Get 4-day forecasts (including current day) FOR ALL individual pollen and spores in the air for all 4 days.
- Personalize your forecasts with quick access to forecasts of specific pollen and spores you are allergic to (up to 7) and up to 5 locations/areas.
- Total of 4 days of forecasts at 80% accuracy rate of the season.
SYMPTOMS
Add your personal information to our calendar system, allowing you to easily track how you feel from day to day on the symptoms page to log your personal allergy calendar. Get tips to minimize your allergy triggers.
MEDICATIONS
Log the medications you take and your own personal treatments as well. You can log the kind of medication or treatments you are using and the amount.
DATA VISUALIZER
With the data visualizer you can analyze your symptoms, the amount of pollen in the air and the medications you took.
Utilize our data visualizer to see how pollen and spore levels correlate with your sentiments and medication. This feature can help you figure out what you are allergic to.
Download the app today to stay informed, reduce exposure, and take control of your allergy season with data you can trust.